SecOps Alerting Processes
Overview
Based on previous conversations had with the Security Operations team, this is the approach being taken to creating alerts for CNH applications. Their main focus is to track login attempts, firewall violations, antivirus scan results, and user statuses. These are not necessarily the same concerns as ours, but their goal is the same: collect application traces and create intelligent alerts to be sent to the right users when needed.
Splunk
The main tool used by the SecOps team is Splunk, a platform used to ingest log data, create metrics, search through events, build dashboards, and serve alerts. It is a well known tool in the cybersecurity and analytics communities that has recently become available at CNH. Data is ingested by Splunk through a variety of different connectors, which can accept data in the form of CSVs, JSON, XML, and structured text files. As it is a relatively mature tool, many connectors have been built that service most of the resources we use on a daily basis, including Azure and the Microsoft 365 environment. If we ever move to a hybrid cloud, Splunk also supports AWS.
Note
There is a connector for Databricks, but the functionality has yet to be explored by CNH.
Splunk works by storing data in indexes that function as repositories that can contain tables, streams, and queues. For example, the index allocated to our group is aiml_team. To get access to this index, you must be part of the Splunk user identity group Splunk_cloud_aiml. You must also have a hardware YubiKey assigned to your account that you use to log in every day. After that, a member of the Splunk administrators team will reach out with login instructions.
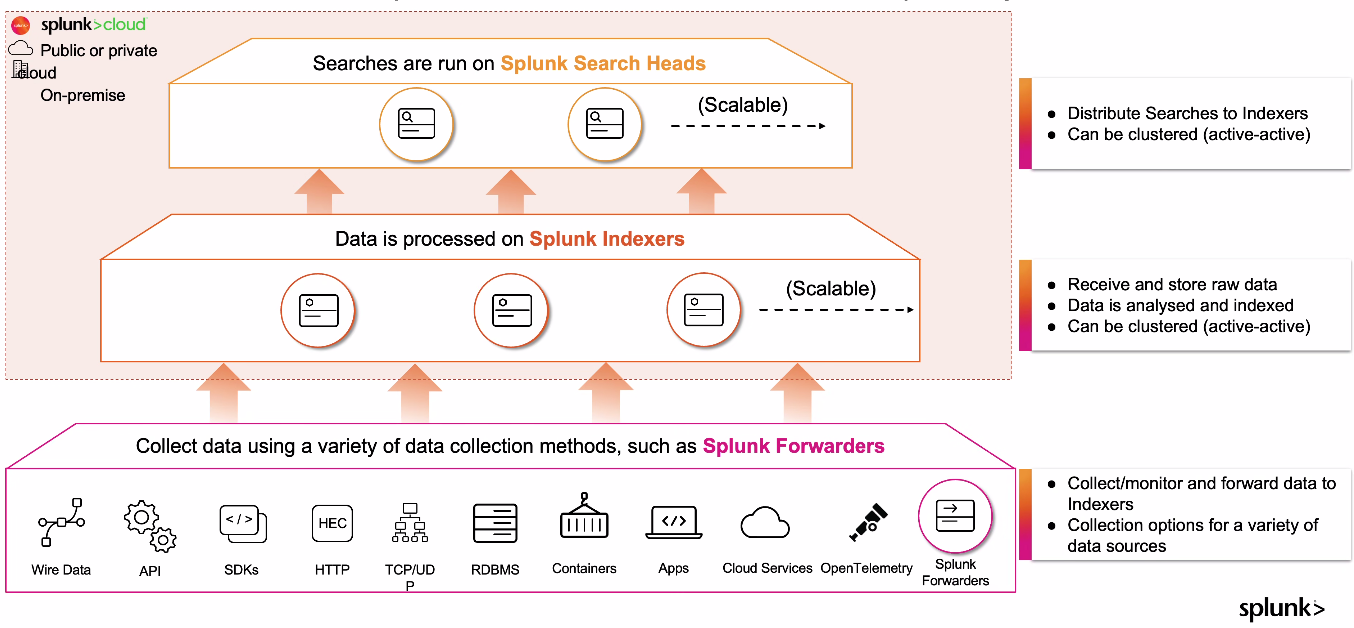
The above image comes from the Splunk4Rookies training that took place at CNH in February 2026
Search Processing Language (SPL)
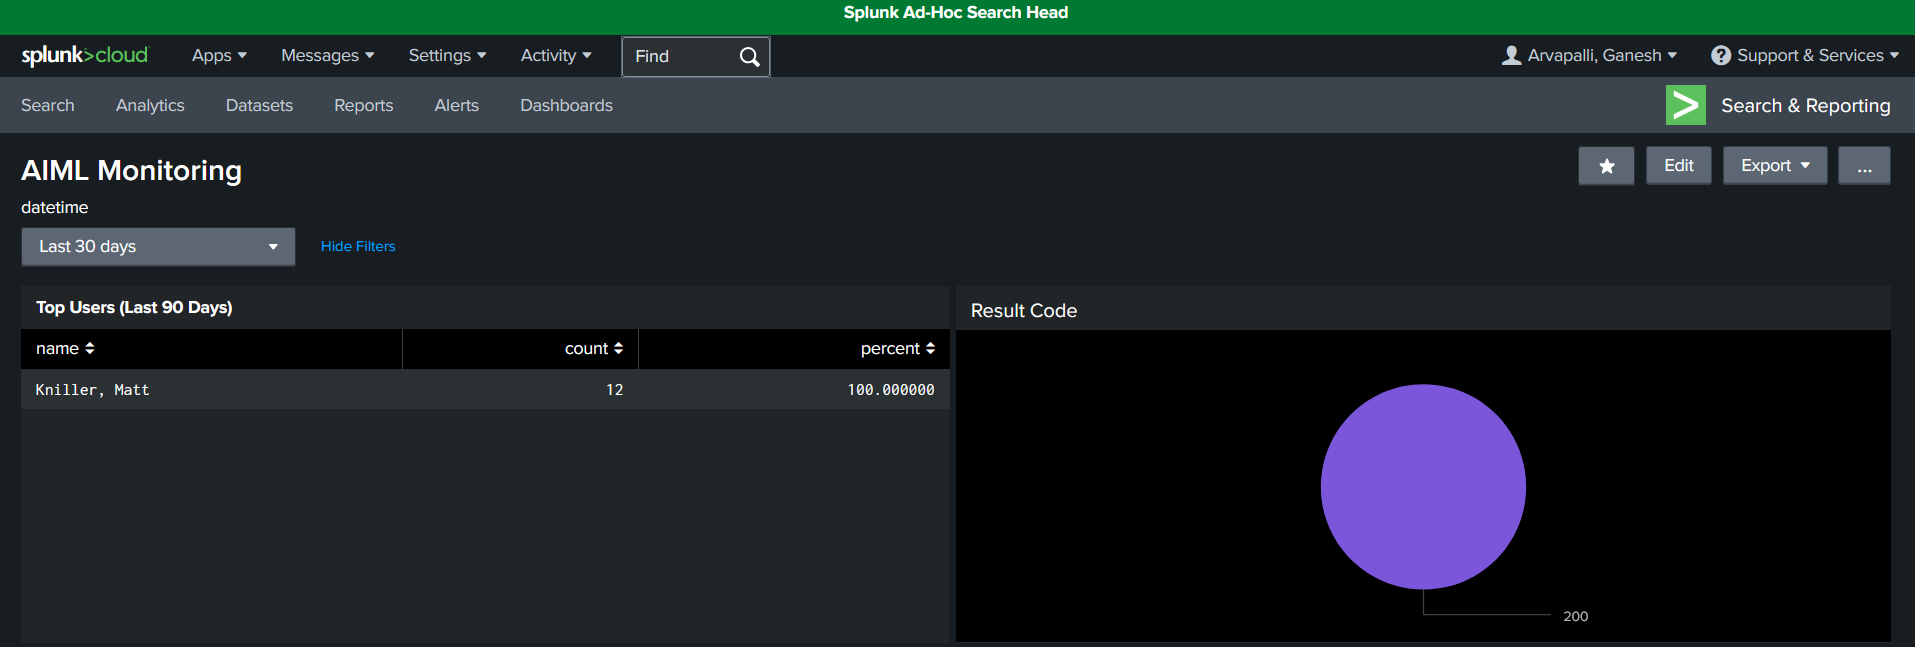
To query data in Splunk, you need to use a new language which has a bit of a learning curve. It's called the Search Processing Language (SPL) and it represents a hybrid of features from SQL (which most of our team is familiar with) and KQL (which is familiar to those who work with Azure). It can perform additional actions on top of queries, such as create metrics and visualizations through keywords built into the language, such as stats and timechart. For example, a complete query I used to pull our list of top Spotlight users was:
index=aiml_team sourcetype=apptraces
| where Message LIKE "REQUEST RCVD    - request:%" AND AppRoleInstance LIKE "ca-aiml-spotlight-api%"
| rex field=Message "REQUEST RCVD    - request:(?<json_payload>(.*))"
| spath input=json_payload output=name userInfo.name
| top limit=20 name
Breaking this down:
- The first line
index=aiml_team sourcetype=apptracesspecifies which source index we are looking at - The second line applies filters
where Message LIKE {format} - The third line extracts a field using regex
rex field={format} - The fourth line interprets that field as JSON
spath input={field_name}, extracting the fielduserInfo.name - The last line takes the top 20 of those names
As can be seen, many of our queries will have to be written specific to each application to ensure we capture the right information. It is also necessary to capture the correct information during the development process, so it can be output as recognizable data into the log table.
SPL is key to the alerting process. All alerts, metrics, and dashboards are required to have associated SPL queries that make it clear the origin of the data and what is being extracted.
Alerts Process
Splunk supports real-time alerting in case of application failure. It executes the SPL code associated with the alert continuously to find logs that meet the search criteria (Ex. 500 errors, failed logins). They can be configured to search over specific time windows, such as encountering X failures in Y minutes, which is called rolling time window triggering. Alternatively, alerts can be throttled such that they do not trigger multiple times after one alert has been sent. This involves specifying a suppression time period for each alert, during which another one will not be issued.
Scheduled alerts can be set to deliver alerts at a specific time. We would likely make heavy use of these as they are less computationally expensive to maintain (and we don't want to misuse the grace of the SecOps team). Our data refresh rate is also unlikely to be in real-time, but it is possible to get new data every 5 minutes to our index. Thus, even scheduled alerts every 5 minutes could be more optimal than real-time alerts as they would prevent overloading. A downtime period of 5 minutes without a notification is not foreseen to cause any impact to our currently deployed applications, but should be kept in mind for future work.
The primary mode of delivery for alerts in Splunk is via email. They also have notifications that appear in Splunk. Kyndryl (our IT services firm) does not get these alerts by default, but they have access to dashboards and can be recipients of emails. If our processes involve maintaining AI/ML systems during non-business hours, it is likely that they will need to be kept in the loop. This could look like scheduled alerts that are delivered when performance does not meet a specific threshold or a job fails to run. Splunk also offers webhooks to integrate with third-party applications in case we would want to work with MS Teams, the paging system, or any other application.
The SecOps team has a process for requesting alerts that requires you to go through ServiceNow. This is to avoid alert fatigue, where constant notifications threaten to overwhelm both inboxes and sanity. The request form can be found at: MISSING-LINK-TBD. Upon submission, the SecOps folks will review the alert request and choose to either approve or disapprove.
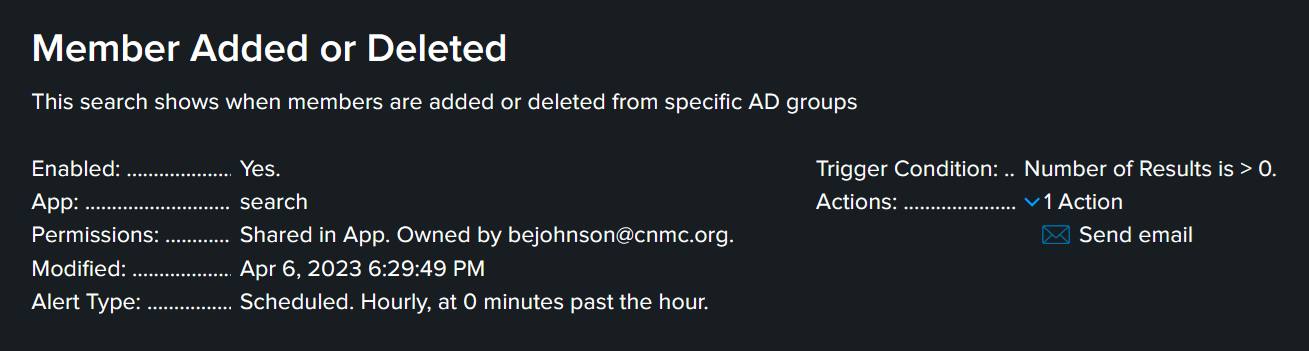
Example Alerts
Dashboarding
To create dashboards in Splunk, you can go through Dashboard Studio. Dashboards are composed of panels containing charts, tables, graphs, and icons to a centralized view. They can be exported to XML code for tracking, but there is no GitHub integration. Think of it as similar to PowerBI or Databricks dashboards in that there is a lot of flexibility with the placement and types of panels, but working directly with the code itself rather than the UI is quite difficult. Merge conflicts are very likely to happen when multiple people contribute to the same dashboard. There is also a Classic Dashboard option, but that has fewer features and flexibility.
When a dashboard is rendered, the SPL search associated with each panel of the dashboard is executed simultaneously. For some queries, this will take a while to execute, so different parts of the dashboard may appear more slowly or quickly depending on the complexity of the logs being analyzed. Once fully visualized, the dashboard can be exported to a PDF for reporting purposes. You can also generate a shareable link to share dashboards with other viewers.
If the Splunk dashboard builder is not enough, there are integrations that can be made with PowerBI via the ODBC drivers.
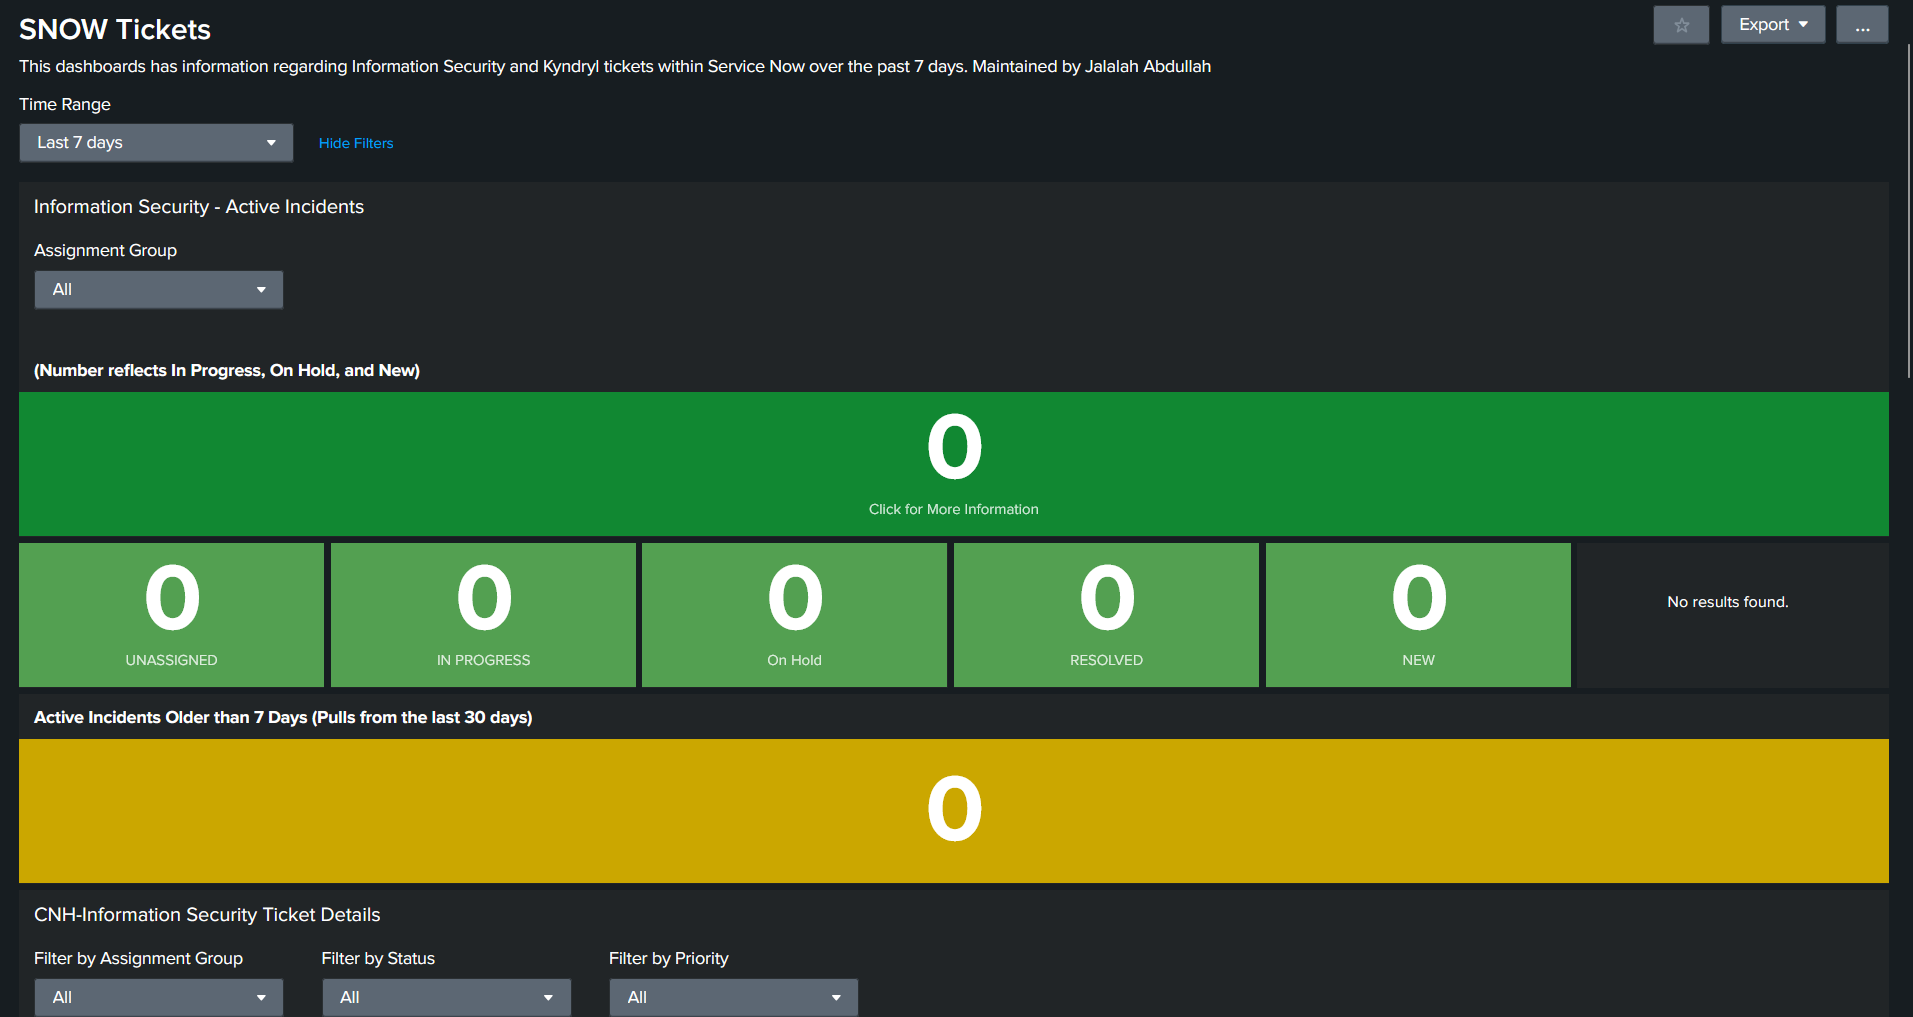
Example Dashboards